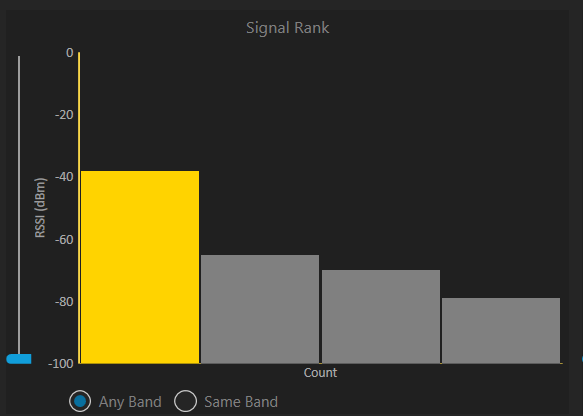
Signal Rank
The signal rank graph within the signal summary tab is a bar graph that shows you the amount of access points in your network, and their respective signal strength to your device. You can edit this graph with the slider on the left to set a threshold for the minimum signal strength and you can change whether you want to display all bands or the same band that you are connected to.
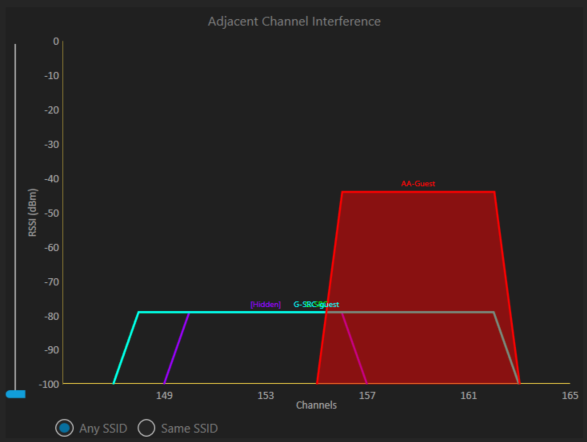
Adjacent Channel Interference
This graph will show you any other networks that are using the same channels as the SSID you have selected in the table view. This graph is helpful in determining possible interference within your network.
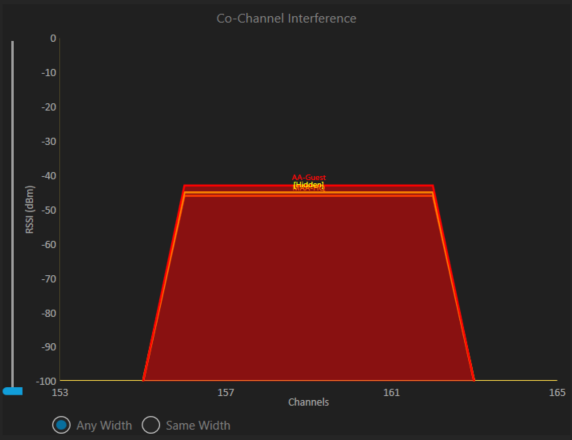
Co-Channel Interference
The co-channel interference graph will display any networks that are using the exact same channels as the SSID you chose in the table view. This will visually show you how many networks are utilizing the same channel as the SSID you have chosen.