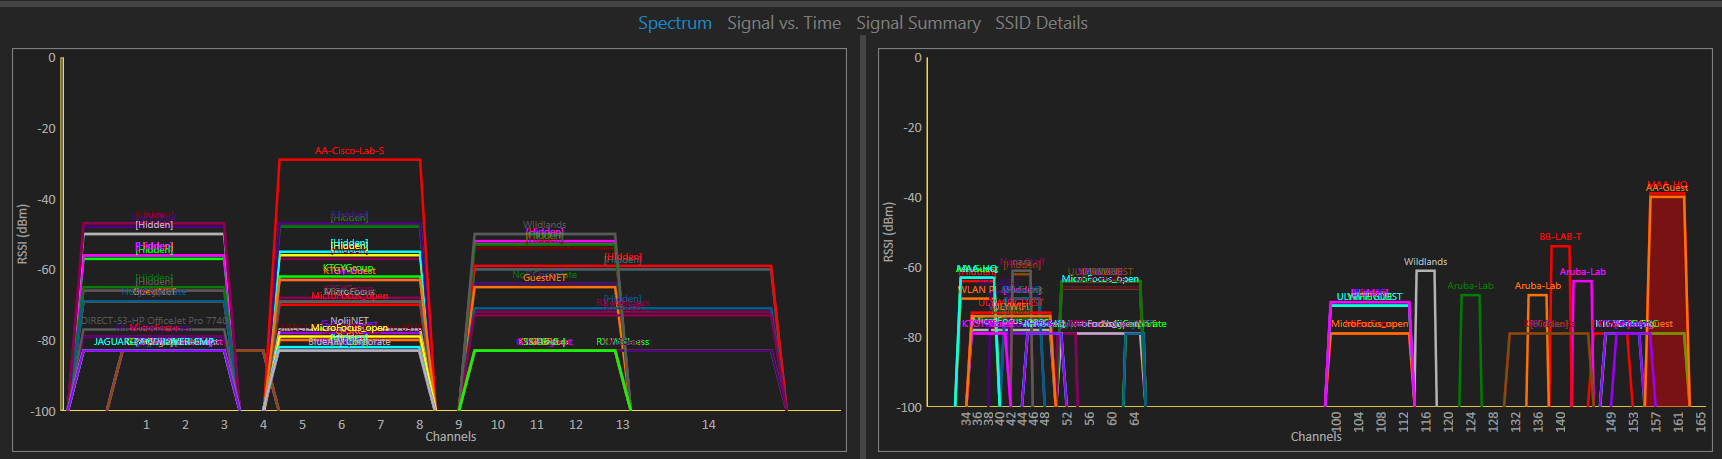
The spectrum tab is a very useful tool within WiFi Scanner. This tab displays two graphs. These two graphs are on the 2.4ghz and 5ghz bands respectively. As you can see, each graph has channels on the x-axis and RSSI (signal strength) on the y-axis. This means that the spectrum graphs will show you which channel each wireless network is on and the signal strength at which your device is receiving.
Remember: each trapezoid displayed will show you one access point, not one wireless network. Therefore, a network may be on many channels.
Why is this important?
This is very important when it comes to planning your own wireless network deployment. The spectrum graphs will show you exactly which channels are being used, or which channels you should avoid. The spectrum tab is one of the first things you should look at when planning your wireless network.