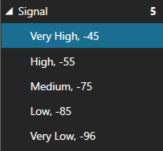
RSSI or signal strength is the quality of a received signal from an access point and is measured in dBm
When looking at WiFi Scanner, you will notice a column for Signal in the table view and RSSI in some of the charts. These values are measured in dBm and the lower the number value, the stronger (or higher quality) your signal is to the access point. You will normally see values ranging from -30 (amazing signal) to -90 (unusable).


In most situations, the closer you are to an access point, the better your signal strength will be. Other factors that will affect signal or RSSI are: interference, output power, and physical barriers.

As you can see, the Signal vs. Time graph in WiFi Scanner will show you your signal over time. This graph is useful to test your signal in different areas of your environment and can help plan access point placement for your network.
